These Are The 20 Worst College Degrees For Finding A Job
As students weigh their post-secondary options, job prospects remain a key consideration.
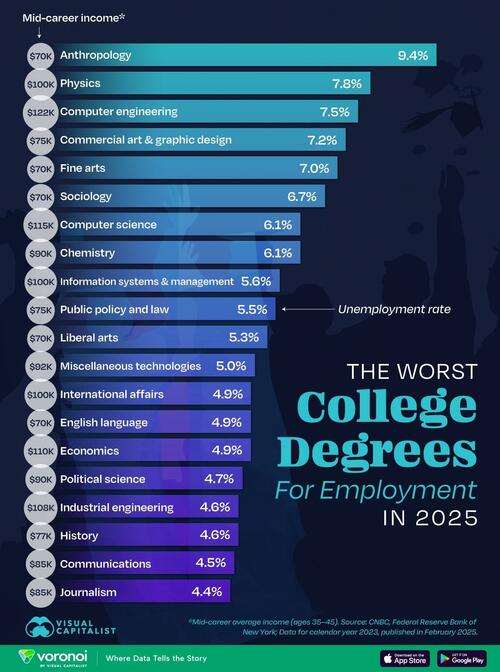
Visual Capitalist's Bruno Venditti reports that new data from the Federal Reserve Bank of New York, current as of May 2025, highlights which college degrees have the highest unemployment rates in the U.S. workforce.
For income, mid-career is defined as ages 35 to 45.
Anthropology Tops the ListAt the top of the list is anthropology. Anthropology majors face an unemployment rate of 9.4%, the highest among the 20 fields analyzed.
Fine arts and sociology follow closely, with unemployment rates of 7.0% and 6.7%, respectively. These degrees tend to offer mid-career salaries around $70,000, placing them on the lower end of the earnings spectrum.
Interestingly, some of the highest-paying degrees also have relatively high unemployment rates.
For instance, computer engineering majors earn a median of $122,000 mid-career, but face a 7.5% unemployment rate. Physics ($100,000) and computer science ($115,000) also show above-average jobless rates, at 7.8% and 6.1%, respectively.
Meanwhile, several liberal arts degrees continue to show a mismatch between pay and employment. English language, history, and liberal arts majors typically earn between $70,000 and $77,000 mid-career, with unemployment rates ranging from 4.6% to 5.3%.
Communications and journalism degrees, which offer earnings closer to $85,000, show slightly lower unemployment levels, around 4.4% to 4.5%.
Other fields such as economics, political science, and international affairs offer stronger income potential—often exceeding $90,000 mid-career—but still face moderate unemployment rates, generally between 4.7% and 5.5%.
While salary remains a strong indicator of economic outcomes, these findings underscore that a higher paycheck doesn’t always guarantee job security.
As the labor market continues to evolve, prospective students may want to weigh both earning potential and employability in their education decisions.
If you enjoyed this graphic, check out this map on Voronoi about the income needed to buy a home in every U.S. state.
Loading...
