Mapped: The Number of Farms in Each U.S. State
Published
6 hours agoon
September 11, 2025 Graphics/Design:![]() See this visualization first on the Voronoi app.
See this visualization first on the Voronoi app.
This was originally posted on our Voronoi app. Download the app for free on iOS or Android and discover incredible data-driven charts from a variety of trusted sources.
Key TakeawaysToday, the average farm in America stands at 466 acres, but there is wide variation across states.
In Rhode Island, the average size is 60 acres—but this jumps to 2,743 in Wyoming. Not only does this highlight the dominance of big farms, but how state economies and different types of agricultural production influence the size and scale of farmland.
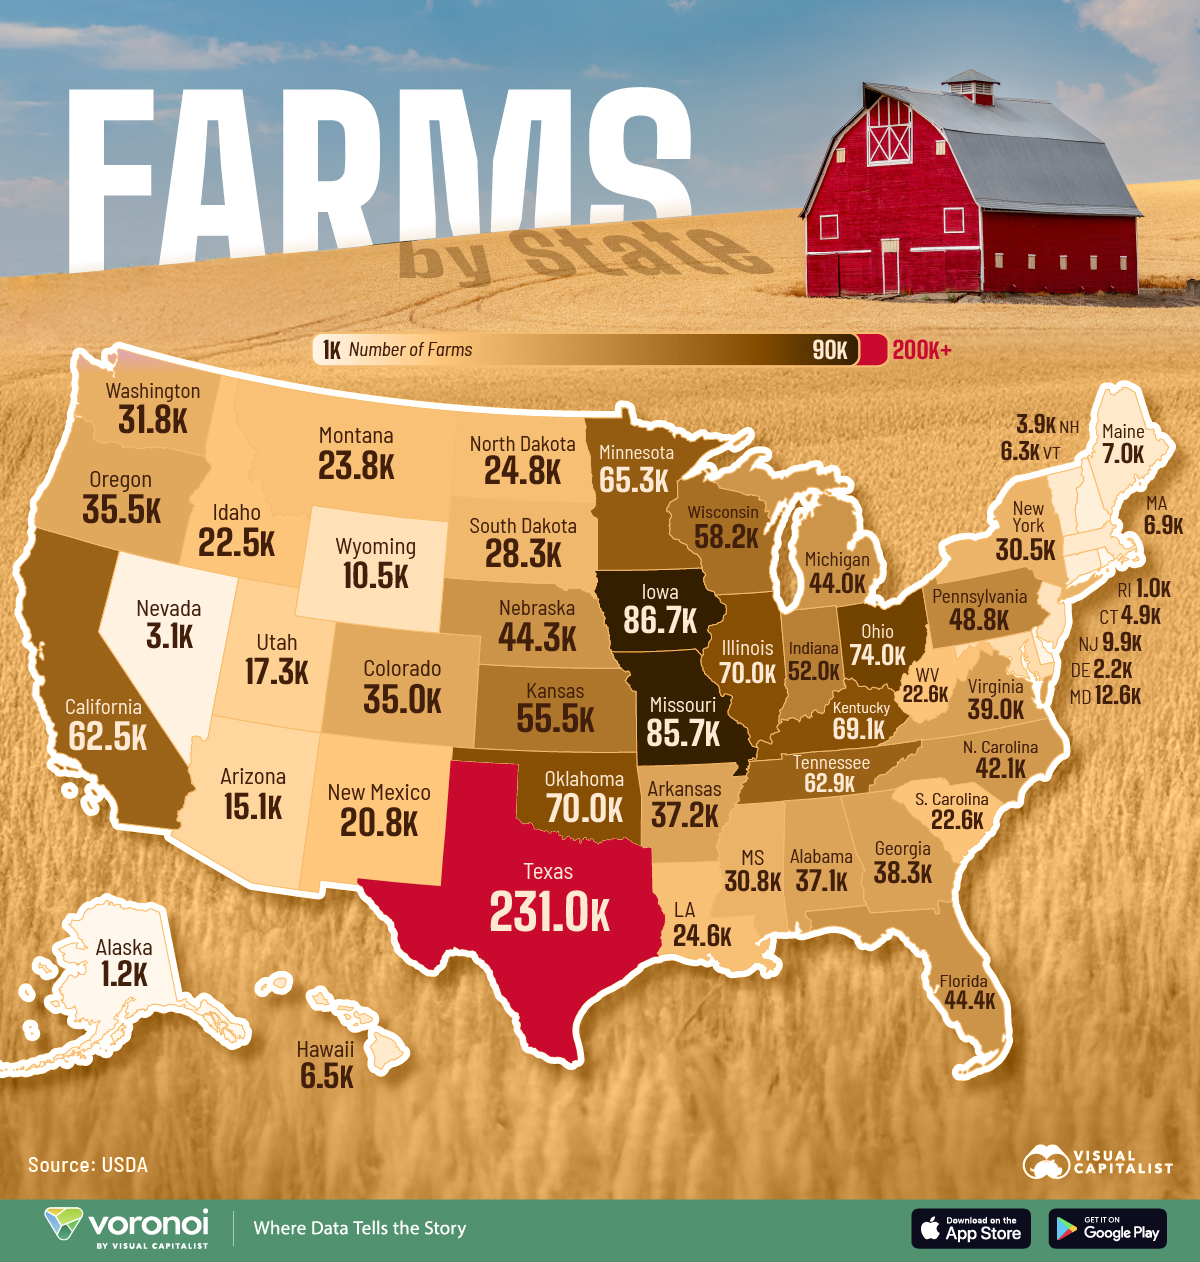
This graphic shows farm counts by state, using data from the U.S. Department of Agriculture.
Texas Has More Farms Than Any Other StateIn the table below, we show the total number of farms in each state in 2024:
| Texas | 231,000 |
| Iowa | 86,700 |
| Missouri | 85,700 |
| Ohio | 74,000 |
| Illinois | 70,000 |
| Oklahoma | 70,000 |
| Kentucky | 69,100 |
| Minnesota | 65,300 |
| Tennessee | 62,900 |
| California | 62,500 |
| Wisconsin | 58,200 |
| Kansas | 55,500 |
| Indiana | 52,000 |
| Pennsylvania | 48,800 |
| Florida | 44,400 |
| Nebraska | 44,300 |
| Michigan | 44,000 |
| North Carolina | 42,100 |
| Virginia | 39,000 |
| Georgia | 38,300 |
| Arkansas | 37,200 |
| Alabama | 37,100 |
| Oregon | 35,500 |
| Colorado | 35,000 |
| Washington | 31,800 |
| Mississippi | 30,800 |
| New York | 30,500 |
| South Dakota | 28,300 |
| North Dakota | 24,800 |
| Louisiana | 24,600 |
| Montana | 23,800 |
| South Carolina | 22,600 |
| West Virginia | 22,600 |
| Idaho | 22,500 |
| New Mexico | 20,800 |
| Utah | 17,300 |
| Arizona | 15,100 |
| Maryland | 12,600 |
| Wyoming | 10,500 |
| New Jersey | 9,900 |
| Maine | 7,000 |
| Massachusetts | 6,900 |
| Hawaii | 6,500 |
| Vermont | 6,300 |
| Connecticut | 4,900 |
| New Hampshire | 3,850 |
| Nevada | 3,100 |
| Delaware | 2,150 |
| Alaska | 1,200 |
| Rhode Island | 1,000 |
With 231,000 farms, Texas has more than double the second-highest state, Iowa.
Across Texas, 2.3 million people are directly employed in the agricultural industry, largely focused on cattle, hay, milk, and corn. Altogether, the industry drove almost $868 billion in economic output last year.
In Iowa, farmland covers 84% of the state’s land area—one of the highest nationally. On average, farms are 346 acres in size, with the state being the largest producer of corn and eggs nationally.
California, meanwhile, is home to 62,500 farms, with dairy production topping $8.6 billion in 2024—the state’s most valuable commodity last year. Additionally, California produces almost 75% of America’s fruits and nuts and over one-third of its vegetables.
On the other end of the spectrum, Rhode Island has just 1,000 farms given its small land area and high population density. Similarly, Alaska (1,200) and Delaware (2,150) each fall at the bottom of the rankings.
Learn More on the Voronoi AppTo learn more about this topic, check out this graphic on the share of farmland by state.
