Mapped: A Snapshot of Global Migration
Published
5 hours agoon
December 27, 2025 Article/Editing: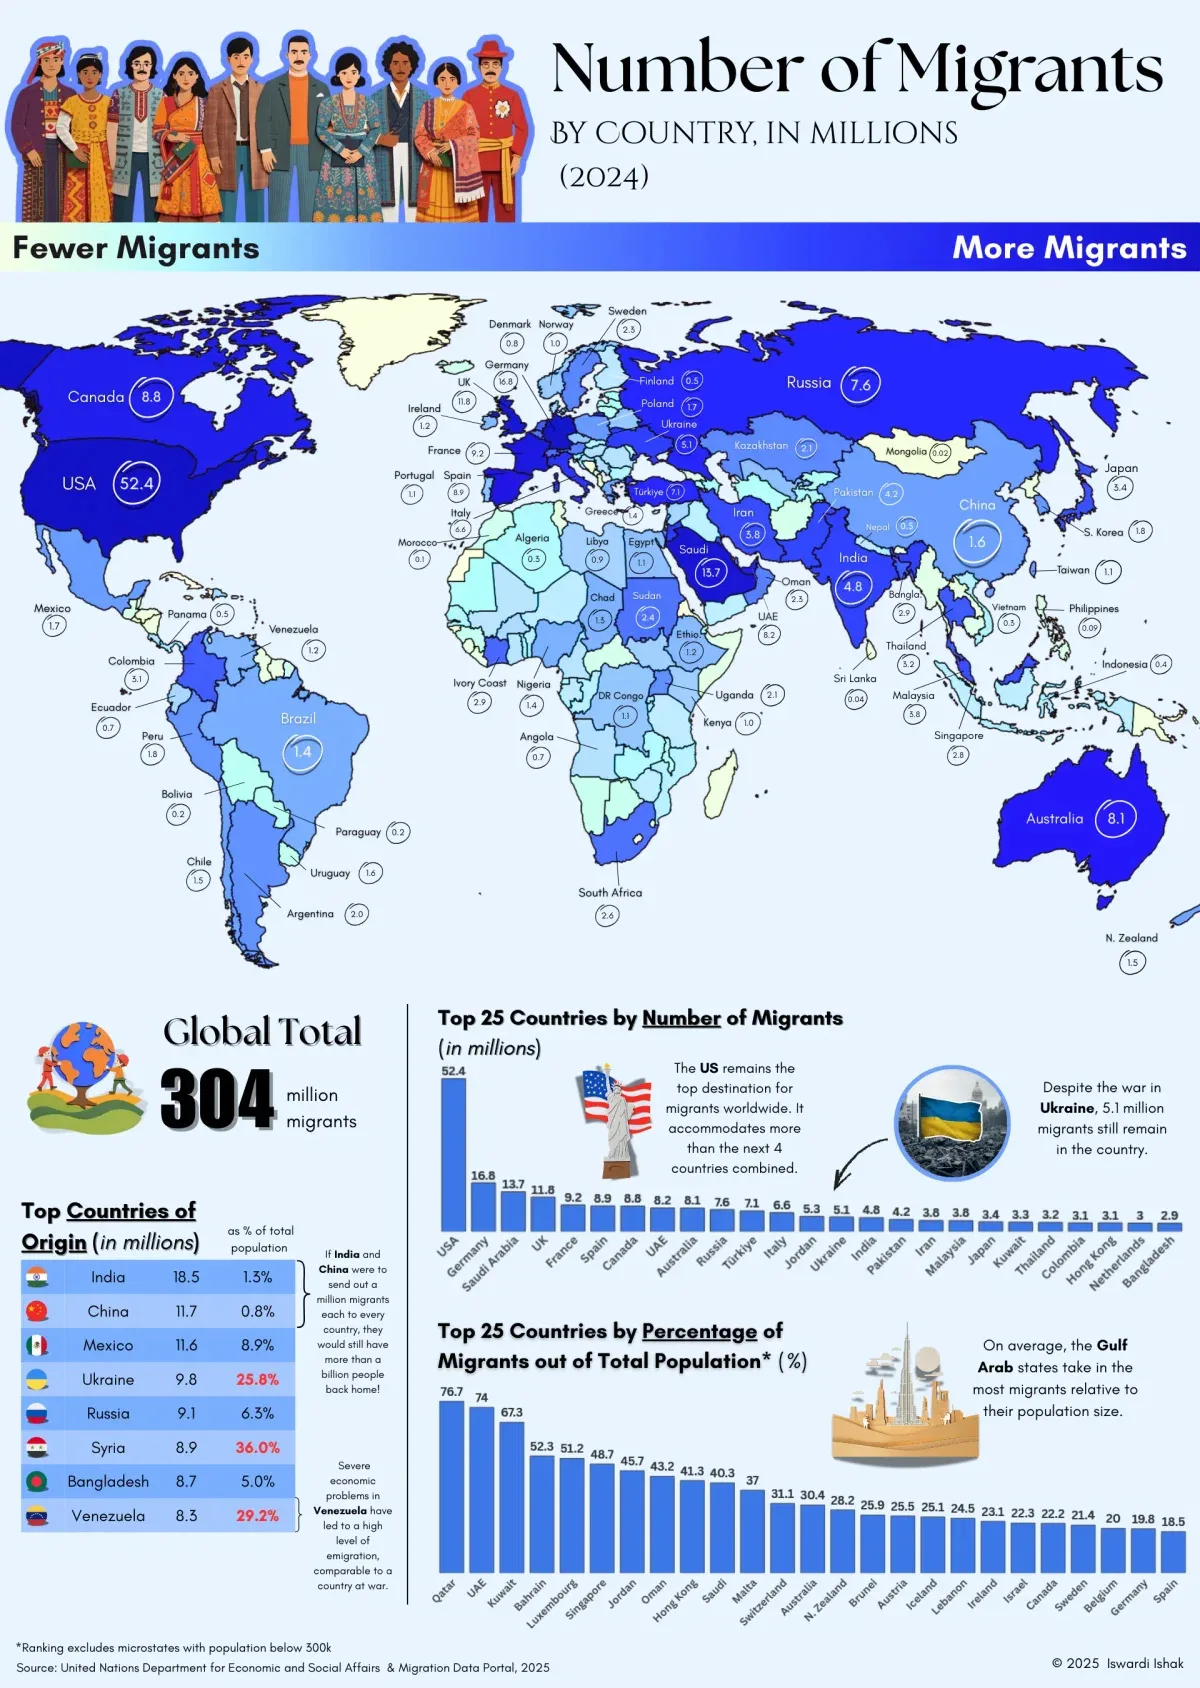
See visuals like this from many other data creators on our Voronoi app. Download it for free on iOS or Android and discover incredible data-driven charts from a variety of trusted sources.
Key TakeawaysPeople have moved across the globe since time immemorial.
In the modern era, migration is often driven by the pursuit of better economic opportunities, improved quality of life, or the desire to reunite with family.
Yet when viewed in aggregate, migration becomes far more than a series of individual decisions. It is a complex global force that reshapes societies, economies, and cultures within countries around the world.
This map visualization by Idwardi Ishak uses data from the United Nations and Migration Data Portal to show a snapshot of global migration in 2024.
Global Migration Data by Country or TerritoryThe below table breaks down total migrants by country or territory, as well as the percentage of migrants of the total population.
| 1 | 🇺🇸 United States | 52,375,047 | 15.2 |
| 2 | 🇩🇪 Germany | 16,750,084 | 19.8 |
| 3 | 🇸🇦 Saudi Arabia | 13,683,841 | 40.3 |
| 4 | 🇬🇧 United Kingdom | 11,845,479 | 17.1 |
| 5 | 🇫🇷 France | 9,186,757 | 13.8 |
| 6 | 🇪🇸 Spain | 8,870,527 | 18.5 |
| 7 | 🇨🇦 Canada | 8,805,839 | 22.2 |
| 8 | 🇦🇪 United Arab Emirates | 8,157,000 | 74.0 |
| 9 | 🇦🇺 Australia | 8,111,404 | 30.4 |
| 10 | 🇷🇺 Russia | 7,605,774 | 5.3 |
| 11 | 🇹🇷 Turkey | 7,083,501 | 8.1 |
| 12 | 🇮🇹 Italy | 6,553,671 | 11.0 |
| 13 | 🇯🇴 Jordan | 5,280,168 | 45.7 |
| 14 | 🇺🇦 Ukraine | 5,064,173 | 13.4 |
| 15 | 🇮🇳 India | 4,796,255 | 0.3 |
| 16 | 🇵🇰 Pakistan | 4,175,958 | 1.7 |
| 17 | 🇮🇷 Iran | 3,840,654 | 4.2 |
| 18 | 🇲🇾 Malaysia | 3,806,514 | 10.7 |
| 19 | 🇯🇵 Japan | 3,409,529 | 2.8 |
| 20 | 🇰🇼 Kuwait | 3,323,191 | 67.4 |
| 21 | 🇹🇭 Thailand | 3,179,399 | 4.4 |
| 22 | 🇨🇴 Colombia | 3,063,518 | 5.8 |
| 23 | 🇭🇰 Hong Kong | 3,063,318 | 41.3 |
| 24 | 🇳🇱 Netherlands | 2,956,518 | 16.2 |
| 25 | 🇧🇩 Bangladesh | 2,906,338 | 1.7 |
| 26 | 🇨🇮 Ivory Coast | 2,880,839 | 9.0 |
| 27 | 🇸🇬 Singapore | 2,841,665 | 48.7 |
| 28 | 🇨🇭 Switzerland | 2,773,840 | 31.1 |
| 29 | 🇿🇦 South Africa | 2,631,100 | 4.1 |
| 30 | 🇸🇩 Sudan | 2,397,113 | 4.8 |
| 31 | 🇧🇪 Belgium | 2,349,032 | 20.0 |
| 32 | 🇶🇦 Qatar | 2,337,000 | 76.7 |
| 33 | 🇦🇹 Austria | 2,327,064 | 25.5 |
| 34 | 🇴🇲 Oman | 2,283,366 | 43.2 |
| 35 | 🇸🇪 Sweden | 2,272,158 | 21.4 |
| 36 | 🇮🇱 Israel | 2,091,569 | 22.3 |
| 37 | 🇰🇿 Kazakhstan | 2,089,797 | 10.2 |
| 38 | 🇺🇬 Uganda | 2,057,759 | 4.1 |
| 39 | 🇦🇷 Argentina | 1,958,039 | 4.3 |
| 40 | 🇵🇪 Peru | 1,837,219 | 5.4 |
| 41 | 🇰🇷 South Korea | 1,811,507 | 3.5 |
| 42 | 🇵🇱 Poland | 1,739,901 | 4.5 |
| 43 | 🇲🇽 Mexico | 1,726,089 | 1.3 |
| 44 | 🇨🇳 China | 1,638,718 | 0.1 |
| 45 | 🇨🇱 Chile | 1,538,324 | 7.8 |
| 46 | 🇳🇿 New Zealand | 1,467,989 | 28.2 |
| 47 | 🇬🇷 Greece | 1,423,964 | 14.2 |
| 48 | 🇱🇧 Lebanon | 1,422,583 | 24.5 |
| 49 | 🇧🇷 Brazil | 1,406,299 | 0.7 |
| 50 | 🇳🇬 Nigeria | 1,403,281 | 0.6 |
| 51 | 🇹🇩 Chad | 1,269,673 | 6.3 |
| 52 | 🇻🇪 Venezuela | 1,263,304 | 4.5 |
| 53 | 🇮🇪 Ireland | 1,216,237 | 23.1 |
| 54 | 🇪🇹 Ethiopia | 1,168,455 | 0.9 |
| 55 | 🇺🇿 Uzbekistan | 1,154,963 | 3.2 |
| 56 | 🇪🇬 Egypt | 1,139,820 | 1.0 |
| 57 | 🇹🇼 Taiwan | 1,136,425 | 4.9 |
| 58 | 🇵🇹 Portugal | 1,127,184 | 10.8 |
| 59 | 🇨🇩 DR Congo | 1,085,090 | 1.0 |
| 60 | 🇧🇾 Belarus | 1,054,604 | 11.6 |
| 61 | 🇨🇿 Czech Republic | 1,025,199 | 9.6 |
| 62 | 🇳🇴 Norway | 1,012,404 | 18.2 |
| 63 | 🇰🇪 Kenya | 992,536 | 1.8 |
| 64 | 🇸🇸 South Sudan | 914,001 | 7.7 |
| 65 | 🇱🇾 Libya | 897,751 | 12.2 |
| 66 | 🇸🇾 Syria | 896,042 | 3.6 |
| 67 | 🇩🇰 Denmark | 847,475 | 14.2 |
| 68 | 🇧🇭 Bahrain | 840,202 | 52.3 |
| 69 | 🇪🇨 Ecuador | 747,749 | 4.1 |
| 70 | 🇧🇫 Burkina Faso | 739,820 | 3.1 |
| 71 | 🇩🇴 Dominican Republic | 738,667 | 6.5 |
| 72 | 🇷🇸 Serbia | 712,550 | 10.6 |
| 73 | 🇭🇺 Hungary | 689,565 | 7.1 |
| 74 | 🇦🇴 Angola | 676,507 | 1.8 |
| 75 | 🇷🇴 Romania | 655,579 | 3.5 |
| 76 | 🇨🇲 Cameroon | 642,948 | 2.2 |
| 77 | 🇨🇷 Costa Rica | 628,404 | 12.3 |
| 78 | 🇲🇱 Mali | 545,323 | 2.2 |
| 79 | 🇬🇭 Ghana | 532,286 | 1.6 |
| 80 | 🇭🇷 Croatia | 527,831 | 13.6 |
| 81 | 🇫🇮 Finland | 514,432 | 9.2 |
| 82 | 🇷🇼 Rwanda | 513,316 | 3.6 |
| 83 | 🇵🇦 Panama | 477,749 | 10.6 |
| 84 | 🇳🇵 Nepal | 470,719 | 1.6 |
| 85 | 🇹🇿 Tanzania | 462,371 | 0.7 |
| 86 | 🇬🇦 Gabon | 449,746 | 17.7 |
| 87 | 🇳🇪 Niger | 449,236 | 1.7 |
| 88 | 🇮🇩 Indonesia | 445,726 | 0.2 |
| 89 | 🇿🇼 Zimbabwe | 429,108 | 2.6 |
| 90 | 🇲🇴 Macau | 426,862 | 59.3 |
| 91 | 🇧🇯 Benin | 418,202 | 2.9 |
| 92 | 🇾🇪 Yemen | 392,997 | 1.0 |
| 93 | 🇧🇮 Burundi | 387,101 | 2.8 |
| 94 | 🇨🇬 Congo | 385,589 | 6.1 |
| 95 | 🇮🇶 Iraq | 370,980 | 0.8 |
| 96 | 🇲🇿 Mozambique | 353,143 | 1.0 |
| 97 | 🇱🇺 Luxembourg | 344,309 | 51.2 |
| 98 | 🇻🇳 Vietnam | 326,418 | 0.3 |
| 99 | 🇸🇰 Slovakia | 323,991 | 5.9 |
| 100 | 🇸🇮 Slovenia | 315,122 | 14.9 |
| 101 | 🇧🇬 Bulgaria | 299,100 | 4.4 |
| 102 | 🇹🇬 Togo | 281,994 | 3.0 |
| 103 | 🇸🇳 Senegal | 281,867 | 1.5 |
| 104 | 🇹🇯 Tajikistan | 276,777 | 2.6 |
| 105 | 🇦🇲 Armenia | 274,645 | 9.2 |
| 106 | 🇵🇸 Palestine | 272,481 | 5.0 |
| 107 | 🇩🇿 Algeria | 259,458 | 0.6 |
| 108 | 🇿🇲 Zambia | 249,205 | 1.2 |
| 109 | 🇬🇶 Equatorial Guinea | 248,930 | 13.2 |
| 110 | 🇬🇲 Gambia | 236,137 | 8.6 |
| 111 | 🇵🇷 Puerto Rico | 223,323 | 6.9 |
| 112 | 🇱🇻 Latvia | 220,471 | 11.8 |
| 113 | 🇦🇿 Azerbaijan | 218,460 | 2.1 |
| 114 | 🇪🇪 Estonia | 203,046 | 14.9 |
| 115 | 🇨🇾 Cyprus | 202,062 | 14.9 |
| 116 | 🇲🇹 Malta | 199,466 | 37.0 |
| 117 | 🇲🇷 Mauritania | 195,937 | 3.8 |
| 118 | 🇰🇬 Kyrgyzstan | 194,816 | 2.7 |
| 119 | 🇹🇲 Turkmenistan | 193,763 | 2.6 |
| 120 | 🇲🇩 Moldova | 188,207 | 6.2 |
| 121 | 🇲🇼 Malawi | 186,719 | 0.9 |
| 122 | 🇧🇴 Bolivia | 183,234 | 1.5 |
| 123 | 🇵🇾 Paraguay | 180,837 | 2.6 |
| 124 | 🇱🇹 Lithuania | 175,194 | 6.1 |
| 125 | 🇺🇾 Uruguay | 160,064 | 4.7 |
| 126 | 🇲🇰 North Macedonia | 150,902 | 8.3 |
| 127 | 🇾🇹 Mayotte | 143,528 | 44.0 |
| 128 | 🇷🇪 Réunion | 135,534 | 15.4 |
| 129 | 🇬🇫 French Guiana | 130,924 | 42.4 |
| 130 | 🇩🇯 Djibouti | 125,996 | 10.8 |
| 131 | 🇧🇳 Brunei | 119,933 | 25.9 |
| 132 | 🇬🇳 Guinea | 117,416 | 0.8 |
| 133 | 🇧🇼 Botswana | 116,402 | 4.6 |
| 134 | 🇳🇦 Namibia | 116,035 | 3.8 |
| 135 | 🇹🇹 Trinidad and Tobago | 113,478 | 7.5 |
| 136 | 🇲🇦 Morocco | 111,069 | 0.3 |
| 137 | 🇮🇸 Iceland | 98,818 | 25.1 |
| 138 | 🇦🇫 Afghanistan | 98,110 | 0.2 |
| 139 | 🇨🇫 Central African Republic | 94,556 | 1.8 |
| 140 | 🇬🇹 Guatemala | 92,732 | 0.5 |
| 141 | 🇲🇪 Montenegro | 92,237 | 14.5 |
| 142 | 🇬🇵 Guadeloupe | 89,610 | 23.9 |
| 143 | 🇵🇭 Philippines | 87,212 | 0.1 |
| 144 | 🇯🇪 Channel Islands | 85,539 | 50.9 |
| 145 | 🇬🇺 Guam | 84,159 | 50.2 |
| 146 | 🇰🇭 Cambodia | 83,925 | 0.5 |
| 147 | 🇬🇪 Georgia | 81,582 | 2.1 |
| 148 | 🇨🇼 Curaçao | 80,020 | 43.1 |
| 149 | 🇲🇲 Myanmar | 79,052 | 0.2 |
| 150 | 🇸🇴 Somalia | 77,972 | 0.4 |
| 151 | 🇳🇨 New Caledonia | 76,738 | 26.2 |
| 152 | 🇲🇻 Maldives | 75,099 | 14.2 |
| 153 | 🇦🇼 Aruba | 73,494 | 68.0 |
| 154 | 🇱🇷 Liberia | 72,423 | 1.3 |
| 155 | 🇧🇿 Belize | 68,706 | 16.5 |
| 156 | 🇲🇶 Martinique | 68,187 | 19.9 |
| 157 | 🇧🇸 Bahamas | 67,285 | 16.8 |
| 158 | 🇹🇳 Tunisia | 63,201 | 0.5 |
| 159 | 🇻🇮 U.S. Virgin Islands | 56,779 | 66.9 |
| 160 | 🇧🇹 Bhutan | 55,705 | 7.0 |
| 161 | 🇬🇾 Guyana | 54,175 | 6.5 |
| 162 | 🇸🇷 Suriname | 51,902 | 8.2 |
| 163 | 🇱🇦 Laos | 51,446 | 0.7 |
| 164 | 🇰🇵 North Korea | 50,439 | 0.2 |
| 165 | 🇸🇱 Sierra Leone | 49,997 | 0.6 |
| 166 | 🇦🇩 Andorra | 48,408 | 59.1 |
| 167 | 🇦🇱 Albania | 46,377 | 1.7 |
| 168 | 🇳🇮 Nicaragua | 43,757 | 0.6 |
| 169 | 🇮🇲 Isle of Man | 43,693 | 51.9 |
| 170 | 🇸🇻 El Salvador | 43,342 | 0.7 |
| 171 | 🇱🇰 Sri Lanka | 40,698 | 0.2 |
| 172 | 🇭🇳 Honduras | 39,901 | 0.4 |
| 173 | 🇲🇬 Madagascar | 38,625 | 0.1 |
| 174 | 🇧🇧 Barbados | 35,187 | 12.5 |
| 175 | 🇧🇦 Bosnia and Herzegovina | 34,120 | 1.1 |
| 176 | 🇸🇿 Eswatini | 33,268 | 2.7 |
| 177 | 🇰🇾 Cayman Islands | 31,935 | 42.9 |
| 178 | 🇵🇬 Papua New Guinea | 31,171 | 0.3 |
| 179 | 🇧🇶 Bonaire | 30,676 | 100.0 |
| 180 | 🇦🇬 Antigua and Barbuda | 30,473 | 32.5 |
| 181 | 🇸🇽 Sint Maarten | 30,148 | 43.0 |
| 182 | 🇵🇫 French Polynesia | 30,099 | 10.7 |
| 183 | 🇲🇺 Mauritius | 29,142 | 2.3 |
| 184 | 🇹🇨 Turks and Caicos Islands | 28,455 | 61.1 |
| 185 | 🇱🇮 Liechtenstein | 27,669 | 69.4 |
| 186 | 🇲🇨 Monaco | 27,106 | 70.2 |
| 187 | 🇻🇬 British Virgin Islands | 24,520 | 62.1 |
| 188 | 🇯🇲 Jamaica | 24,007 | 0.9 |
| 189 | 🇦🇸 American Samoa | 23,684 | 50.6 |
| 190 | 🇲🇳 Mongolia | 22,589 | 0.7 |
| 191 | 🇲🇵 Northern Mariana Islands | 22,000 | 49.7 |
| 192 | 🇧🇲 Bermuda | 20,171 | 31.2 |
| 193 | 🇭🇹 Haiti | 19,581 | 0.2 |
| 194 | 🇨🇻 Cape Verde | 16,515 | 3.2 |
| 195 | 🇬🇼 Guinea-Bissau | 15,064 | 0.7 |
| 196 | 🇱🇸 Lesotho | 15,039 | 0.6 |
| 197 | 🇫🇯 Fiji | 14,362 | 1.6 |
| 198 | 🇸🇨 Seychelles | 13,261 | 10.2 |
| 199 | 🇪🇷 Eritrea | 12,512 | 0.4 |
| 200 | 🇰🇲 Comoros | 12,449 | 1.4 |
| 201 | 🇬🇮 Gibraltar | 11,291 | 28.7 |
| 202 | 🇩🇲 Dominica | 8,440 | 12.8 |
| 203 | 🇹🇱 East Timor | 8,303 | 0.6 |
| 204 | 🇫🇴 Faroe Islands | 8,101 | 14.6 |
| 205 | 🇱🇨 Saint Lucia | 8,079 | 4.5 |
| 206 | 🇰🇳 Saint Kitts and Nevis | 7,958 | 17.0 |
| 207 | 🇬🇩 Grenada | 7,340 | 6.3 |
| 208 | 🇦🇮 Anguilla | 5,918 | 40.5 |
| 209 | 🇸🇲 San Marino | 5,838 | 17.4 |
| 210 | 🇬🇱 Greenland | 5,812 | 10.4 |
| 211 | 🇪🇭 Western Sahara | 5,628 | 1.0 |
| 212 | 🇵🇼 Palau | 5,212 | 29.5 |
| 213 | 🇨🇰 Cook Islands | 4,937 | 36.0 |
| 214 | 🇻🇨 Saint Vincent and the Grenadines | 4,820 | 4.8 |
| 215 | 🇼🇸 Samoa | 3,843 | 1.8 |
| 216 | 🇹🇴 Tonga | 3,581 | 3.4 |
| 217 | 🇻🇺 Vanuatu | 3,315 | 1.0 |
| 218 | 🇲🇭 Marshall Islands | 3,309 | 8.8 |
| 219 | 🇰🇮 Kiribati | 3,302 | 2.5 |
| 220 | 🇫🇲 Micronesia | 2,894 | 2.6 |
| 221 | 🇳🇷 Nauru | 2,548 | 21.3 |
| 222 | 🇸🇧 Solomon Islands | 2,469 | 0.3 |
| 223 | 🇫🇰 Falkland Islands | 2,333 | 67.2 |
| 224 | 🇨🇺 Cuba | 2,144 | 0.0 |
| 225 | 🇼🇫 Wallis and Futuna | 2,032 | 18.0 |
| 226 | 🇸🇹 São Tomé and Príncipe | 1,955 | 0.8 |
| 227 | 🇹🇰 Tokelau | 1,282 | 3.0 |
| 228 | 🇵🇲 Saint Pierre and Miquelon | 1,008 | 17.9 |
| 229 | 🇳🇺 Niue | 588 | 32.3 |
| 230 | 🇻🇦 Vatican City | 496 | 100.0 |
| 231 | 🇸🇭 Saint Helena | 492 | 9.4 |
| 232 | 🇹🇻 Tuvalu | 246 | 2.6 |
As of 2024, the world’s migrant population has reached 304 million people, reflecting a steady rise in cross-border movement.
The United States continues to stand apart as the world’s pre-eminent destination, hosting 52.4 million migrants, which is more than the next four destination countries combined.
Other major recipients include Germany, Saudi Arabia, and the United Kingdom, underscoring how advanced economies and energy-rich states rely heavily on foreign-born workers to sustain growth, fill labor shortages, and offset aging populations.
Origin Stories: Where Global Migrants Come FromLooking at where migrants come from tells a different story. India and China remain the largest sources of people living abroad, a reflection of their vast populations and deep integration into global labor markets. In these cases, migration is often driven by economic opportunity rather than displacement.
By contrast, countries such as Ukraine, Syria, and Venezuela illustrate how conflict, political instability, and economic collapse can rapidly reshape migration flows. In these cases, migration is less a choice than a necessity, with sudden surges driven by crises that spill across borders.
Where Migrants Make Up the MajorityOne of the most striking patterns in the data appears in the Gulf states. Countries like Qatar, the United Arab Emirates, and Kuwait have some of the highest migrant-to-population ratios in the world, with foreign-born residents accounting for a majority of the workforce.
These economies depend heavily on migrant labor across construction, services, and energy-related industries.
Small island territories and city-states—such as Monaco, Luxembourg, and Singapore—also report exceptionally high shares of migrants, reflecting their openness, economic specialization, and limited domestic labor pools.
At the other end of the spectrum, much of Africa and South America remains characterized by relatively modest levels of immigration when measured as a share of population. That said, internal and regional mobility is increasing, suggesting that migration pressures are shifting rather than disappearing.
Migration as a Structural ForceTaken together, the data depict a world in which migration is no longer the exception but the norm. Labor demand in wealthy nations, demographic aging, and persistent instability in parts of the developing world ensure that borders—however politicized—remain porous to people as well as to goods and capital.
As governments grapple with immigration policy, the underlying forces driving migration continue to intensify, making it one of the defining economic and social dynamics of the 21st century.
Learn More on the Voronoi AppWhich U.S. cities have the biggest migrant communities by share of population? See this map to find out.

This article was published as a part of Visual Capitalist's Creator Program, which features data-driven visuals from some of our favorite Creators around the world.