The Air Quality Scam
By Stan Young, PhD and Warren Kindzierski, PhD
Guest post on Dr. Robert Malone’s Substack
We’ve spent decades watching epidemiology turn into something between a cargo cult and a magic show. Worse still, university epidemiologists and government public health policymakers have been trying to convince us for decades that the air we breathe is killing us — and that only trillion-dollar regulatory regimes stand between us and the grave.
We just published a paper in the Journal of the Academy of Public Health that pulls back the curtain on this scam. The response has been... well, the usual deafening silence from the regulatory priesthood. Let’s walk you through the scam.
First, let’s be honest about where the air quality panic comes from. There were three genuine events where a combination of temperature inversions, acid in the air, and particulate matter resulted in deaths:
· London Fog, 1952 (and again in 1956 and 1962) — Temperature inversions trapped coal smoke, soot, and industrial gases causing 4,000 excess deaths in 1952 (and 1,000 in 1956 and another 700 in 1962).
· Meuse River Valley, Belgium, December1930 — Same story. Inversion, trapped industrial emissions, 60 deaths.
· Donora, Pennsylvania, October 1948 — Ditto, 20 deaths.
These events were real, and here’s the part nobody mentions: these conditions literally cannot occur today. Modern emissions controls and clean air regulations eliminated the conditions that created those killing fogs. Using these events to justify an air quality panic is like citing the 1918 flu to justify locking down for a common cold.
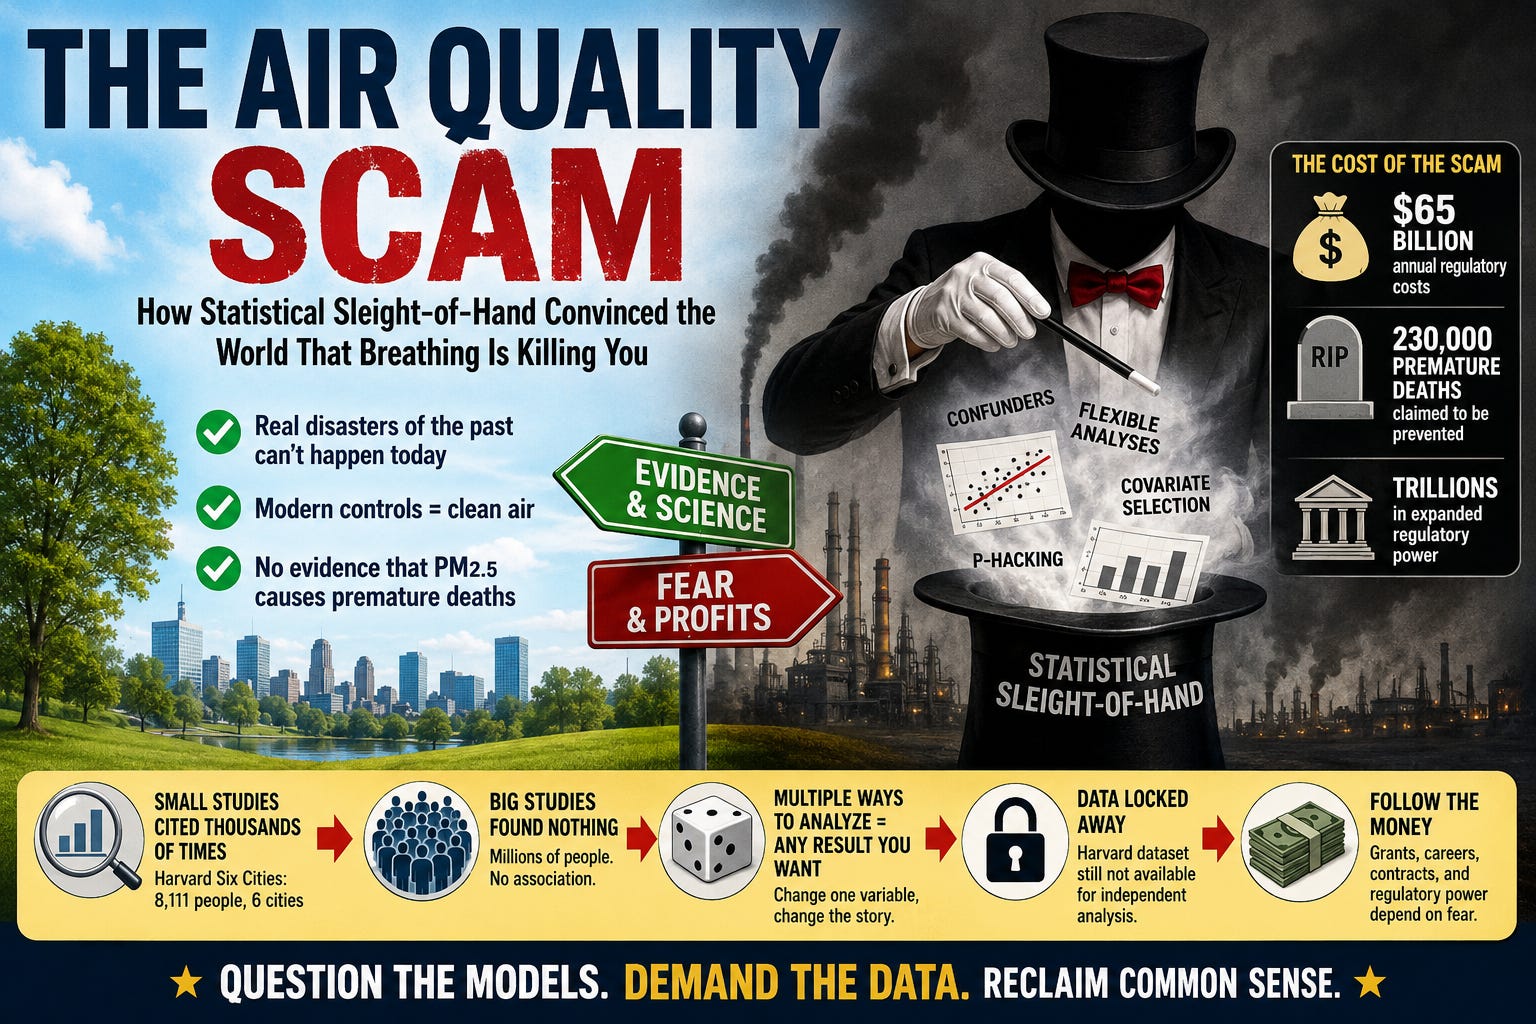
Yet the Environmental Protection Agency (EPA) still claims particulates in air can cause premature deaths. In 2011, the agency estimated Clean Air Act compliance costs at $65 billion annually and claimed the regulations would prevent 230,000 premature deaths in 2020.
Let’s look at the evidence.
Particulate Matter (PM) refers to microscopic solid or liquid particles suspended in the air, classified by their aerodynamic diameter.
PM10 encompasses inhalable coarse particles with diameters of 10 micrometers (μm) or less. These particles are small enough to pass through the nose and throat into the lungs but are generally filtered out in the upper respiratory tract. Common sources include wind-blown dust, pollen, mold spores, and construction dust.
PM2.5 refers to fine particles with diameters of 2.5 micrometers (μm) or less. These are small enough to penetrate deep into the lungs and enter the bloodstream, posing higher health risks such as respiratory and cardiovascular issues. They originate from combustion sources like vehicle exhaust, industrial emissions, and wildfires.
Technically, PM2.5 is a subset of PM10, meaning all PM2.5 particles are included in the PM10 measurement, but PM10 also includes larger particles between 2.5 and 10 μm.
This argument can be traced back to two 1990 studies, both partially funded by the EPA. One became famous, the other ignored.
The 1993 Harvard Six Cities study followed 8,111 adults across six American cities for 16 years. Over that period, 1,430 people died. The researchers claimed that fine particles in air (PM2.5) increased deaths by 26%.
Let that sink in. Eight thousand people. Six cities. The “sample size” for statistical purposes? Six. Because the comparisons were across cities, not individuals. You can’t get much statistical power from six data points unless you’re using very creative math. Nevertheless, it has been cited over 11,000 times in literature.
A 1995 National Institute of Statistical Sciences study looked at over 785,000 deaths among elderly people across two counties over six years. Their finding? No association between PM10 — which is highly correlated with PM2.5 — and deaths. When you breathe, you breathe both.
The EPA even secured Harvard’s dataset and, along with industry, partially funded another group of epidemiologists to reanalyze it. The result, published in 2000? If you followed Harvard’s exact analysis, you got roughly the same answer. But if you varied the analysis method — changed a covariate, adjusted for a different confounder — the effect fell apart completely.
The EPA did not secure the NISS dataset for reanalysis. Why would you scrutinize a study that found nothing?
Thanks for reading Malone News! This post is public so feel free to share it.
After Harvard, two major air quality‒premature death studies dwarfed it in scale:
One study in 2011 used individual-level data from a population of 18.2 million (with 3.2 million deaths) across 814 US locations over the period 2000 to 2006. They found effects across locations but noted these were “likely due to unmeasured confounders.” Their within-location analysis? Direct quote: “We are not able to demonstrate any change in life expectancy for a reduction in PM2.5.”
The other study in 2017 used individual-level data from a population of roughly 20 million people (with over 2 million deaths) in eight California air basins over the period 2000 to 2012. They found no association between PM2.5 and daily deaths.
Just to recap… Harvard’s study: 8,111 people and a positive association between PM2.5 and deaths. Later studies: millions of people, no association.
Here’s the problem nobody in public health wants to discuss… give a complex dataset to different analysts, pose the same research question to them, and watch what happens. You can literally get any result you want.
Researchers at Yale recognized this problem back in 1988 (see here and here). They initially identified 56 medical and pharmaceutical research claims from observational studies in literature, then they tracked down other studies on the same topics from the same period. The result — they found 136 studies supporting the claims and 127 contradicting them. This is coin-flip territory.
The president of the Biometrics Society gave his 2002 Presidential Address noting that when his regression class students were given the same dataset and question as homework, they produced dramatically different results.
Today, we know from “multiverse analysis” (many-analyst studies, examples here and here) — where independent teams get the same data and same research question — that there are thousands of seemingly reasonable ways to run an analysis, with wildly different results depending on analysis choices.
A concrete example… Smith (2021) analyzed PM2.5‒premature death associations in Medicaid data. He showed that simply removing one covariate — previous day’s temperature — flipped PM2.5 from non-significant to statistically significant. One variable. That’s the difference between “air quality kills” and “nothing to see here.” And researchers have thousands of choices like this to make in their analysis.
Here’s what should keep you up at night… the 2011 (Greven) study demonstrated that when you use individual-level data with proper spatio-temporal modeling, the PM2.5‒premature death association evaporates. It’s a gold-standard approach — individual deaths, precise timing, geographic granularity, and the statistical power of millions of observations.
So why hasn’t Harvard released their Six Cities study dataset in a form that would allow someone to run a Greven-style analysis on it? The original dataset, as far as anyone outside the inner circle can tell, remains locked away.
The 2000 reanalysis commissioned by the EPA and industry was conducted under controlled conditions with the original Harvard team hovering nearby — and even then, the effect crumbled when the analysis method was varied.
Thirty-plus years later, the Six Cities study — that anchors billions of dollars in EPA regulatory costs — has never been independently reproduced from its raw data with modern methods. In any other field, this would be called what it is… science by press release, sustained by data hoarding.
Here’s what the world doesn’t see happening in the university research‒journal publishing game:
· Most studies that do not find positive associations — the negative studies — go unpublished. Researchers put them in file drawers and move on.
· Researchers in other studies can use flexible designs and selectively report their results to nudge what should be non-significant results to significant.
· Journals prefer publishing positive studies. No editor wants to headline “nothing to see here” in a study.
· False positive studies that are published can get canonized — endlessly cited until everyone assumes they’re settled fact.
Academics make up most of the journal peer review and editorial positions. The academic publishing and tenure process functions as natural selection of bad science. Career incentives reward splashy positive findings, not careful null results. The Harvard Six Cities study was a small positive study that became famous. The larger negative studies that followed? Ignored.
The EPA justifies its existence and its $65 billion annual regulatory burden by claiming lives are being saved. University researchers who produce studies showing air quality harms public health get grants, publications, tenure, and prestigious appointments. Journals who publish these studies get citations and impact factors. The environmental consulting industry gets contracts.
Who benefits from a null result? Nobody. Who loses? Everyone with a stake in the university‒government‒journal publishing industrial complex.
The National Association of Scholars published a detailed report that we co-authored on how selective research methods gives rise to irreproducible claims for PM2.5 and premature deaths, heart attacks, and asthma attacks. It’s called Shifting Sands — apt, because the scientific foundation for these claims keeps moving if you look closely at the methods.
Air quality‒premature death epidemiology, as currently practiced, looks like a statistical fluke — an artifact of analytical flexibility, publication bias, and unaccounted confounding dressed up as public health consensus.
The genuine air disasters of the mid-20th century were real. But they bear no resemblance to current conditions. The Harvard Six Cities study methods crumble under scrutiny. Larger, better-designed studies that followed found nothing. Using the 1952 London fog and Harvard Six Cities study to justify regulatory overreach today is intellectually dishonest.
Multiverse analyses show that different reasonable analytical choices produce contradictory results in research. And the entire journal publication ecosystem is structurally biased toward publishing false positive research.
Are there real environmental health threats worth addressing? Absolutely. Smoking, asbestos fiber inhalation, foodborne illness outbreaks (e.g., from E. coli) — these are genuine concerns with plausible mechanisms of harm. But the PM2.5‒premature death panic is a house of cards built on statistical sleight-of-hand and institutional self-preservation.
The next time someone tells you that air quality is shaving years off your life, ask them one question: Which covariate did you leave out?
Stan Young, PhD, is a statistician and can be reached at genetree@bellsouth.net. Warren Kindzierski, PhD, is a retired college professor (public health) and can be reached at warrenk@ualberta.ca. Young and Kindzierski authored the paper “Are air quality–health effect claims a statistical analysis fluke?” published in the Journal of the Academy of Public Health.